Export information
We now present several command provided in DD-suite to get and export useful information about the constructed DDs.
Get and print DD information
We can obtain information about a DD's construction and reduction time using the functions implemented in DD-suite. Our implementation provides a get_building_time() function to get the time it took to construct a DD (either exact, relaxed or restricted). In addition, the user can get the time it took to reduce any DD with the get_reduce_dd_builder_time() command.
print("-- Exact DD information --")
print("\tConstruction time (sec): ", dd_exact.get_building_time())
print("\tReduction time (sec): ", dd_exact.get_reduction_time())

print("-- Relaxed DD information --")
print("\tConstruction time (sec): ", dd_relaxed.get_building_time())
print("\tReduction time (sec): ", dd_relaxed.get_reduction_time())

print("-- Restricted DD information --")
print("\tConstruction time (sec): ", dd_restricted.get_building_time())
print("\tReduction time (sec): ", dd_restricted.get_reduction_time())
cout << "-- Exact DD information --\n";
cout << "\tConstruction time (sec): " << dd_exact.get_building_time() << "\n";
cout << "\tReduction time (sec): " << dd_exact.get_reduction_time() << "\n";

cout << "-- Relaxed DD information --\n";
cout << "\tConstruction time (sec): " << dd_relaxed.get_building_time() << "\n";
cout << "\tReduction time (sec): " << dd_relaxed.get_reduction_time() << "\n";

cout << "-- Restricted DD information --\n";
cout << "\tConstruction time (sec): " << dd_restricted.get_building_time() << "\n";
cout << "\tReduction time (sec): " << dd_restricted.get_reduction_time() << "\n";
The code also allows the user to directly access the DD graphical structure using the get_decision_diagram() command. From there, we can obtain the number of nodes and arcs with the get_node_count() and get_arc_count() functions, respectively.
Exporting DD graph
We have also implemented a fucntionality to export the DD graph into a .gml file using the export_graph_file(). The user can specify the filename and the file will be saved automatically in the working directory.
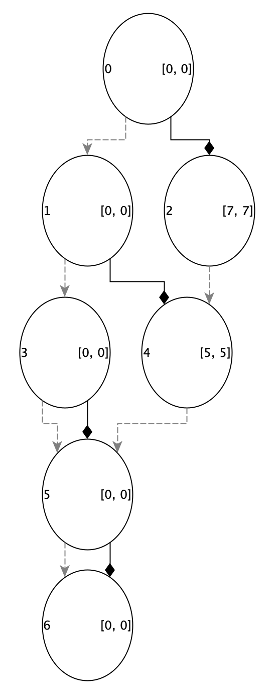
This file can be opened with the free yED software to visualize the constructed DD. To properly visualize the DD graph, go to Layout in the top bar of yED, press Hierarchical, and then Ok. You should see the following image for the exact DD of our running example:
Notes:
- Solid arcs represent variable assignments equal to 1, and dashed arcs represent variable assignments equal to 0.
- The export function prints the node id inside each node and the state as specified by the
get_state_as_string()function implemented for each problem (see, for instance, theKnapsackProblemclass in theExamplesfolder).
Since DD can grow exponentially, we recommend using this functionality only on small problem instances (i.e., no more than 10 variables and 20 nodes per layer).